Note
Click here to download the full example code
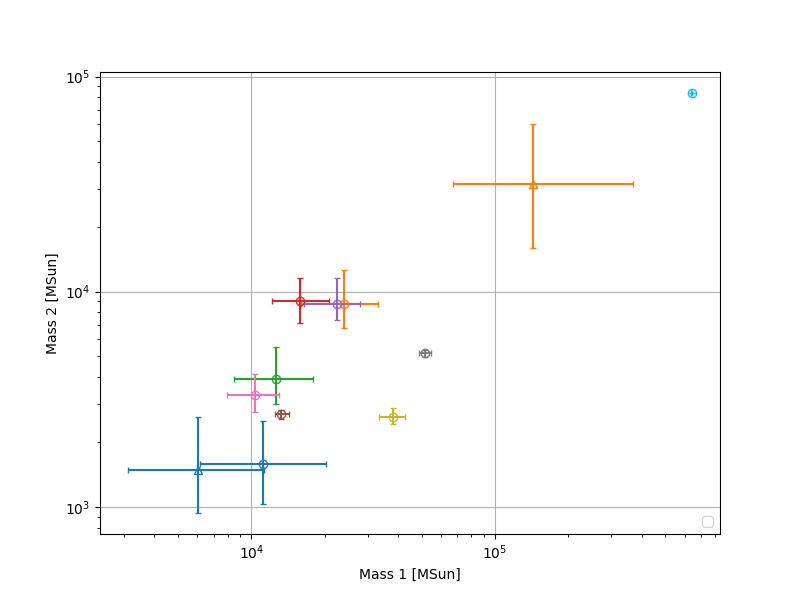
Catalog mass plot
Plot component masses of all detections
import matplotlib.pyplot as plt
import numpy as np

from lisacattools.catalog import GWCatalogs
from lisacattools.catalog import GWCatalogType

# get list catalog files
catPath = "../../tutorial/data/mbh"
catalogs = GWCatalogs.create(GWCatalogType.MBH, catPath, "*.h5")
last_cat = catalogs.get_last_catalog()
detections_attr = last_cat.get_attr_detections()
detections = last_cat.get_detections(detections_attr)

# plot the catalog in the m1-m2 plane
fig, ax = plt.subplots(figsize=[8, 6], dpi=100)
ax.set_xscale("log", nonpositive="clip")
ax.set_yscale("log", nonpositive="clip")
ax.grid()
ax.set_xlabel("Mass 1 [MSun]")
ax.set_ylabel("Mass 2 [MSun]")
ax.legend(loc="lower right")
srcs = list(detections.index)
for idx, src in enumerate(srcs):
    sample = last_cat.get_source_samples(src)
    l1, m1, h1 = np.quantile(np.array(sample["Mass 1"]), [0.05, 0.5, 0.95])
    l2, m2, h2 = np.quantile(np.array(sample["Mass 2"]), [0.05, 0.5, 0.95])
    if idx < 10:
        mkr = "o"
    else:
        mkr = "^"
    ax.errorbar(
        m1,
        m2,
        xerr=np.vstack((m1 - l1, h1 - m1)),
        yerr=np.vstack((m2 - l2, h2 - m2)),
        label=src,
        markersize=6,
        capsize=2,
        marker=mkr,
        markerfacecolor="none",
    )


plt.show()
Total running time of the script: ( 0 minutes 1.173 seconds)